Index
Introduction
Open data portals are becoming increasingly common online. These portals aim to make available data public and accessible to both citizens and businesses.
However, some open data portals are not regularly updated, or their data contains persistence errors. Therefore, it is crucial to know how to analyze data correctly. determine the update quality of each portal, and improve the visualization of the values obtained so that they are understandable by any user.
In this way, A traffic light system has been developed to determine, in real time, the quality of the data of the GRAFCAN Meteorological API, This is because it is usually a highly valuable dataset. This traffic light system provides metrics on the reliability of data updates, allowing businesses and users to use the API with confidence.
On the other hand, in the current state of the pandemic, the use of open data has been indispensable for numerous companies and citizens, who could know the cumulative incidence of cases (among other data of interest) in their area in real time. Due to the importance this data has had in today's society, it has been decided To make predictions about the cumulative incidence of COVID-19 in Tenerife, based on open data.
Context
The rise of Open Data in recent years has been extraordinary. Specifically, in Spain in 2013 there were 5,000 datasets available on various official portals. Currently, there are more than 45,000. datasets unified in the same portal. This development has increased the use of public data by citizens, making it more necessary than ever to monitor the updating of portals to avoid problems with the data obtained.
The project could have continued investigating other portals with a similar methodology. However, after conducting a manual analysis, we observed that the COVID-19 data is updated daily and has very high reliability, so a system as elaborate as the one created with GRAFCAN is not required. On the other hand, making predictions with this data is a field that has been less explored and may be more relevant with this specific dataset.
To understand the topic of predictions using COVID-19 data, it's necessary to explain what a time series is. A time series can be defined as a collection of observations of a variable collected sequentially over time. Time series have four characteristics (components) that help interpret their behavior, which are detailed in the report. The libraries used to make the predictions are: Prophet y Neural Prophet.
Project summary
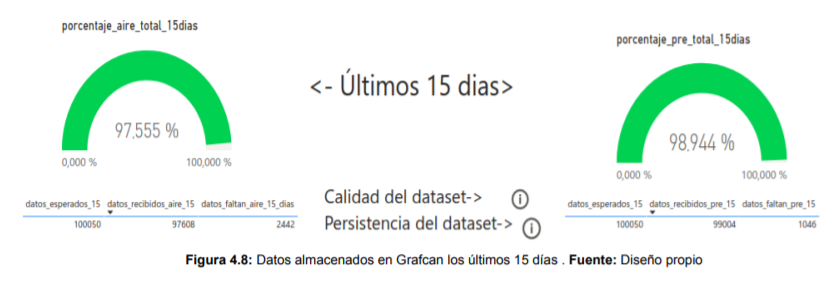
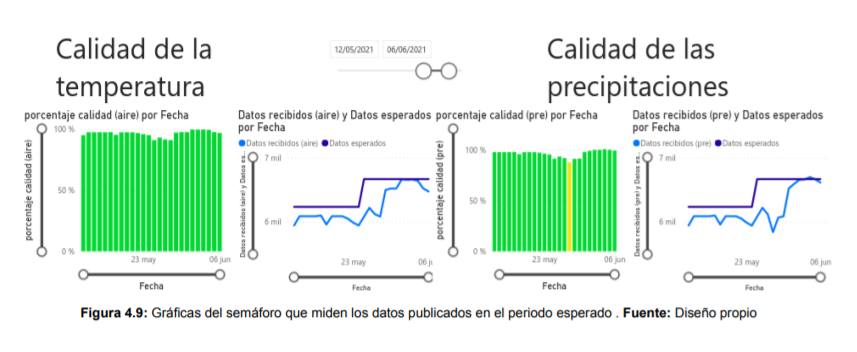
The project is based on the use of open data. To determine the reliability of GRAFCAN's API updates, Business Intelligence was employed, employing various strategies and tools to transform abstract information into actionable knowledge. Specifically, four ETL processes were performed in Python to obtain and transform the data. Additionally, a dashboard was created using Power BI, simulating a traffic light system, which allows for real-time monitoring of update data, making it more user-friendly.
The results show that the API is functioning well. The total dataset obtained is very large, the quality of the data in its first publication is typically between 92% and 97%, and persistence is adequate.
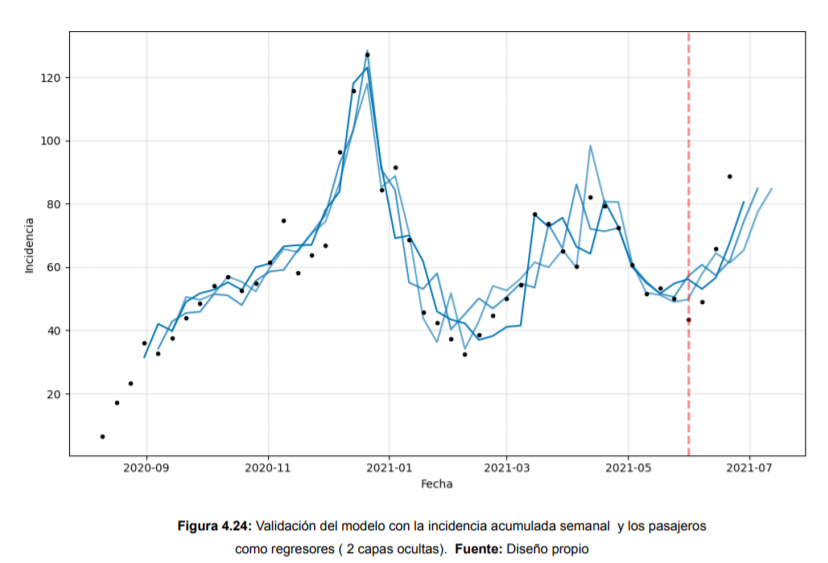
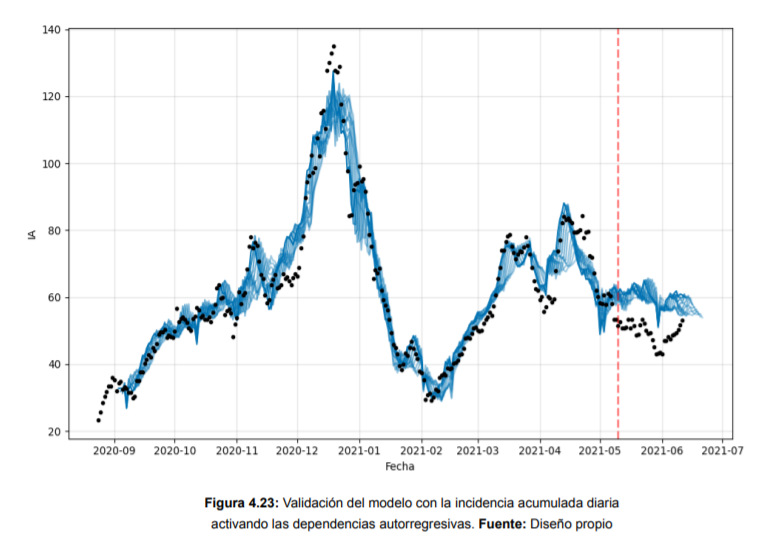
On the other hand, with regard to dataset Following an analysis of the collected data on COVID-19, predictive models of the cumulative incidence on the island of Tenerife were developed. Initially, Prophet, an open-source library compatible with Python and R, was used. Its primary characteristic is the interpretability of its hyperparameters, modeling trends, seasonal variations, and holidays. Subsequently, Neural Prophet, a PyTorch-based library that combines Prophet's interpretability with neural networks, was employed. Unlike Prophet, Neural Prophet allows the addition of lagged regressors—other variables that can improve the prediction. For this reason, tourists from Great Britain and Germany traveling to Tenerife were added as regressors, as they can influence the cumulative incidence curve.
In this final degree project, the results of both models are compared, under equal conditions and with the best hyperparameters obtained.
More information
The report on the work is publicly available at the Institutional Repository of the University of La Laguna.
- Author: Brian Samir Santamaría Valero
- Tutor: José Luis Roda García
- Co-tutor: Ginés León Rodríguez

